Android Studio tools that will improve your productivity
3 Android Studio tools that I am going to list below will not only improve productivity but also help in writing more robust code.

Android Studio tools listed below are currently available in Preview versions of the IDE as an experimental feature, at the time of writing this article (EDIT: All these tools are now available in the stable version of Android Studio Giraffe). And it is always recommended to have a stable version installed alongside the preview version. Preview versions of Android Studio are listed here: https://developer.android.com/studio/preview
So without further ado, we will go through the list:
1. Live Edit:
Live Edit has made it to the set of new features that are getting shipped with the Android Studio Electric Eel release. This feature was initially intended to be a part of the Android Studio Flamingo Canary release but I see this feature has made it through to the EE Beta release as well. So we will not have to wait for AS Flamingo’s release to get hands-on with this feature. Attaching a snippet from the current release notes:

What is Live Edit?:
With Live Edit, We can now instantly deploy the code changes made in the composable functions to an emulator or actual device. This works in real-time, so there is no need to run the app again if the changes are confined to composable functions.
Key benefits of Live Edit:
This functionality minimizes context switches between writing and building your app, allowing you to focus on writing code longer without interruption.
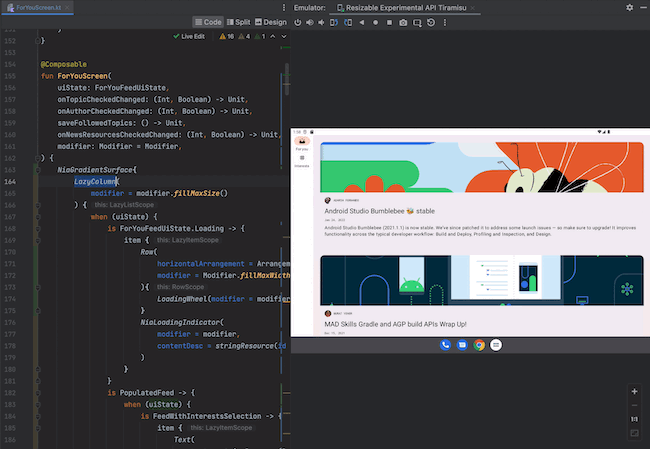
Enable Live Edit:
If you are making use of Jetpack Compose to create your app UI, Live edit can help in making quick UI tweaks/fixes without running complete builds every time.
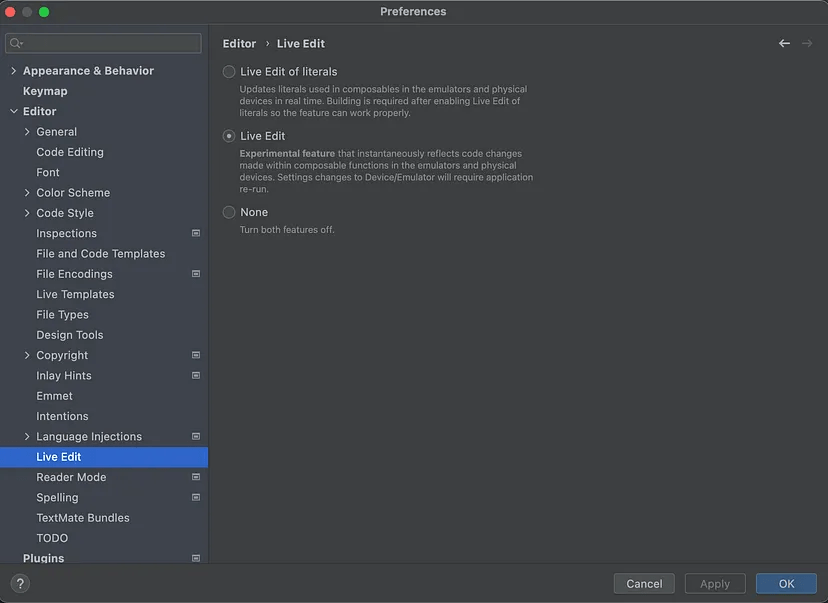
In the IDE, navigate to the settings to enable Live Edit.
- On Windows or Linux, navigate to File > Settings > Editor > Live Edit.
- On macOS, navigate to Android Studio > Preferences > Editor > Live Edit.
- In the IDE, open the launcher activity that loads the composable view
- Run your app and then click Split on the top right of the editor to open the preview
- you should see the Live Edit green checkmark on the top right of the editor
Limitations:
Live Edit comes with its own set of limitations, some of these are listed below:
1. Live Edit is focused on UI- and UX-related code changes. Live Edit doesn’t support changes such as method signature updates, adding new methods, or class hierarchy changes
2. Live Edit requires a physical device or emulator that is running API level 30 or higher.
3. Non-Composable functions are updated live on the device or emulator and a full recomposition is triggered. The full recomposition might not invoke the updated function. For non-composable functions, you must trigger the newly updated functions, or Run the app again.
4. You must perform a full Run in order for the debugger to operate on classes that you have modified with Live Edit.
2. App Quality Insights from Firebase Crashlytics
Starting with Android Studio Electric Eel, Firebase Crashlytics data can be accessed from Android Studio IDE itself. Crash stats and stack traces can be found in the newly introduced App Quality Insights tool window in the IDE
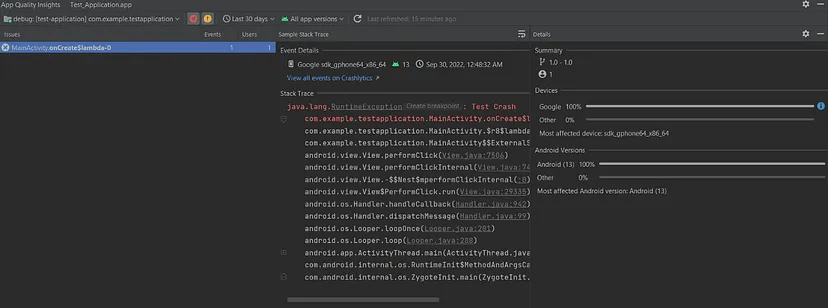
Key benefits of this integration:
Key Benefits of integrating Crashlytics with Android Studio are listed below:
- No need to go back and forth between Crashlytics browser window and IDE. Stack traces are now visible directly in the IDE window which makes it easy to click on a stack trace and jump to relevant lines of code
- Android Studio now highlights lines of code that are related to crashes so you can easily spot and debug them. When you hover over a highlighted line of code, a pop-up appears that shows the crash details. This popup itself provides easy navigation to App quality Insights window
- Filter events by severity, time, and app version from Android Studio itself
How to connect Crashlytics with Android Studio:
For Integration, you need to sign in to Android Studio with your developer account. If you already have an app available in the Firebase console that has Crashlytics enabled, then open the App Quality Insights tool window and You should see the Issues, Sample Stack Trace, and Details panels populate with reports from Crashlytics
If you are yet to setup Firebase Crashlytics for your app, then follow this tutorial below which has all the details regarding Crashlytics integration with Android Studio
3. Network Inspector for traffic interception
Network Inspector shows all traffic data for the full timeline by default. You can select a range within the timeline to see only the traffic in that range. So whenever an app makes a network call, it will be logged in to the Network Inspector
NOTE: This feature is currently available only in the Android Studio Flamingo Canary release
How to use Network Inspector
With Network Inspector, we can create rules to determine what responses to intercept and how to modify intercepted responses before they reach the app.
We can create custom rules to test the app against different use cases. These rules can help in testing how the app behaves when we receive specific responses from the server. You can choose which rule to enable or disable by checking the Active box next to each rule.
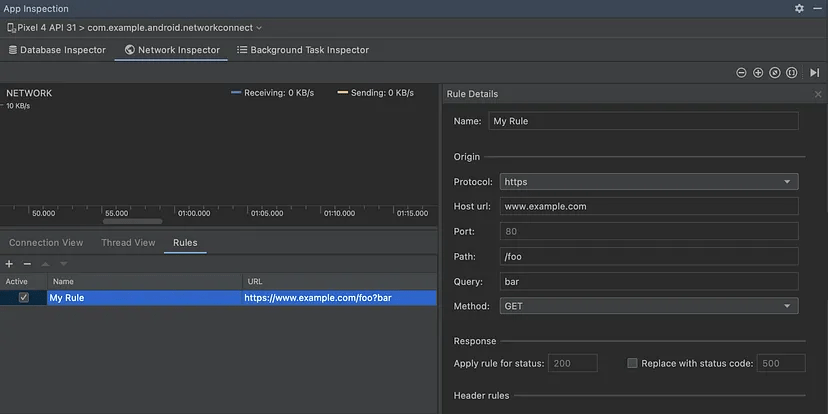
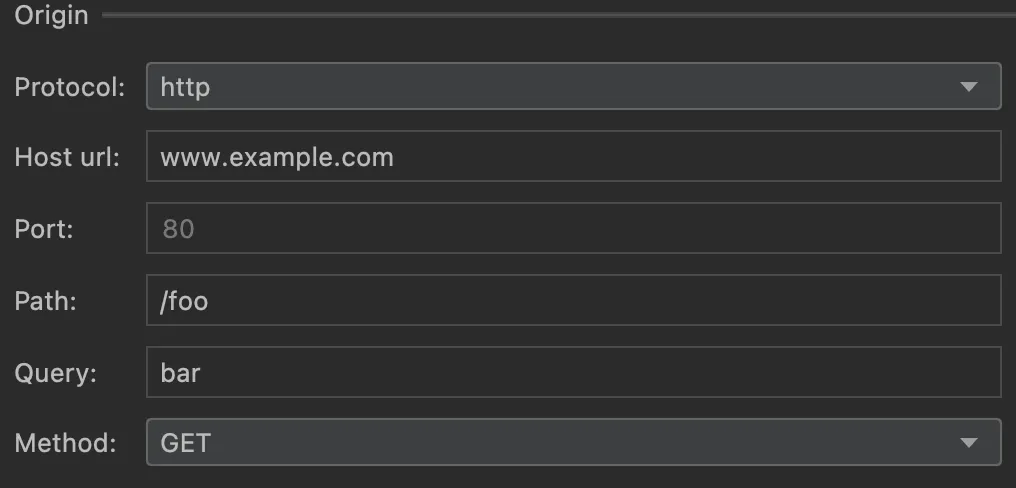
To create a new Rule, navigate to the Rules tab in the Network Inspector and click + to create a new rule. In the Rule Details panel, name your new rule and include information about the origin of the response you want to intercept under the Origin subsection.
Possible Modifications in the Response:
- Modify headers:
In the Header rules subsection, we can create multiple sub-rules that add or modify headers in a response.
To add a header, enter a name and value for the header in the Add new header section.
To modify a header, navigate to the Edit existing header tab and specify the header name or value that you want to find. Enter a header name or value that you want to replace it with. - Modify Responses:
We can also create sub-rules to modify the body of the response. We can choose to either Find and Replace a section of the body or can choose to replace the entire content of the body by selecting Replace the entire body.
This brings me to the end of the article and I hope these tools will certainly help you in improving your productivity
If you liked the article, please share this and add a comment.