Get Firebase Crashlytics insights directly in the Android Studio
Table of Contents
Overview
Starting with Android Studio Electric Eel, Firebase Crashlytics reports can be accessed from Android Studio IDE itself.
Crash stats and stack traces can be found in the newly introduced App Quality Insights tool window in the IDE
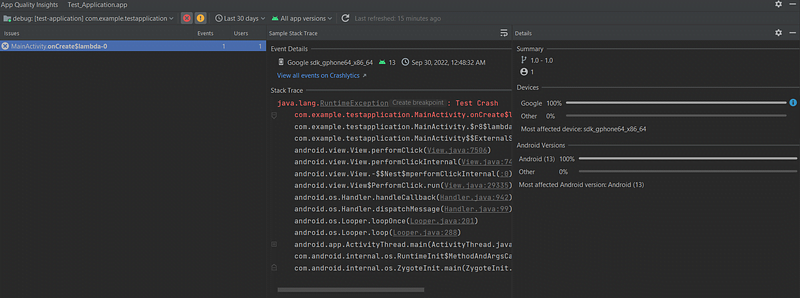
This feature is available in the stable version of the Android Studio. The latest version of the Android Studio can be found here: https://developer.android.com/studio
Key benefits of this integration:
- Navigate easily from Stack trace to code
No need to go back and forth between the Crashlytics browser window and IDE. Stack traces are now visible directly in the IDE window which makes it easy to click on a stack trace and jump to relevant lines of code
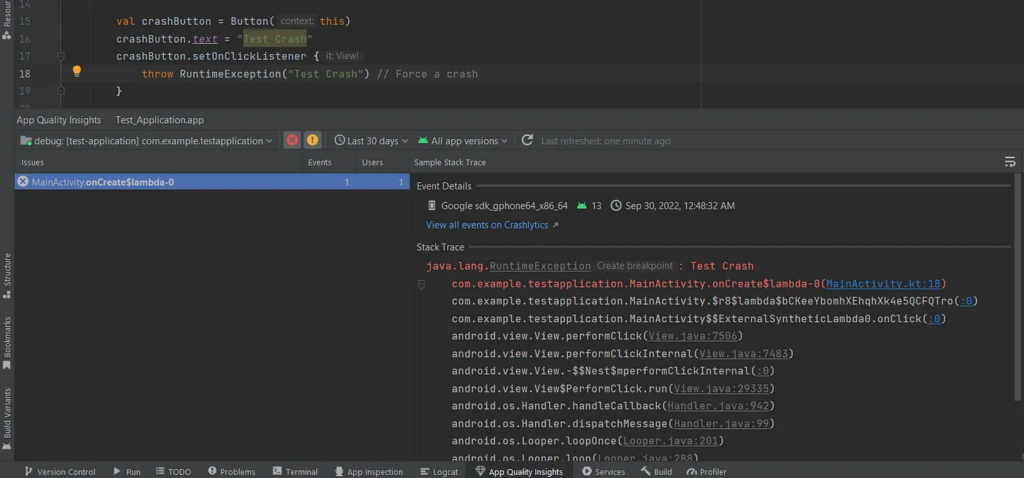
- Easy Navigation from code to stack traces
In addition to being able to navigate from stack trace to code, you can also jump from code to stack trace: Android Studio now highlights lines of code that are related to crashes so you can easily spot and debug them. When you hover over a highlighted line of code, a pop-up appears that shows the event involved, its frequency, and the number of devices affected.
You can click on Open in App Quality Insights to jump to the event details in the App Quality Insights tool window.
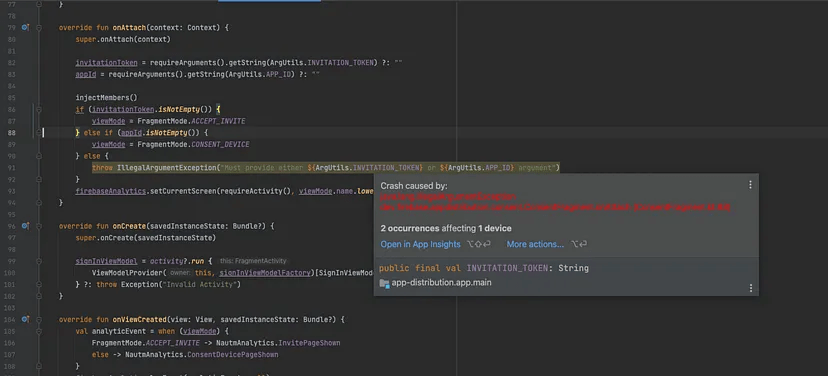
- Summary of a crash can be accessed from IDE
Crash statistics can be seen in the Android studio. Crash details will have a summary of crashes grouped by the device manufacturer and Android version.
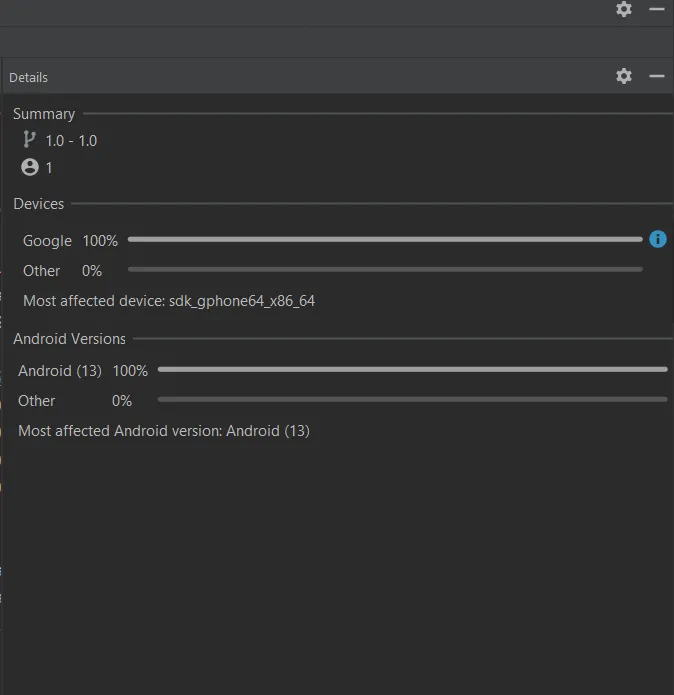
- Filter events by severity, time, and app version

How to connect Firebase Crashlytics to the Android Studio
In this section, we will see how Crashlytics can be connected to the Android Studio.
- If you have already added Crashlytics to your app, then all you need to do is sign in to the Android Studio using the same developer account which has access to your app in Firebase.
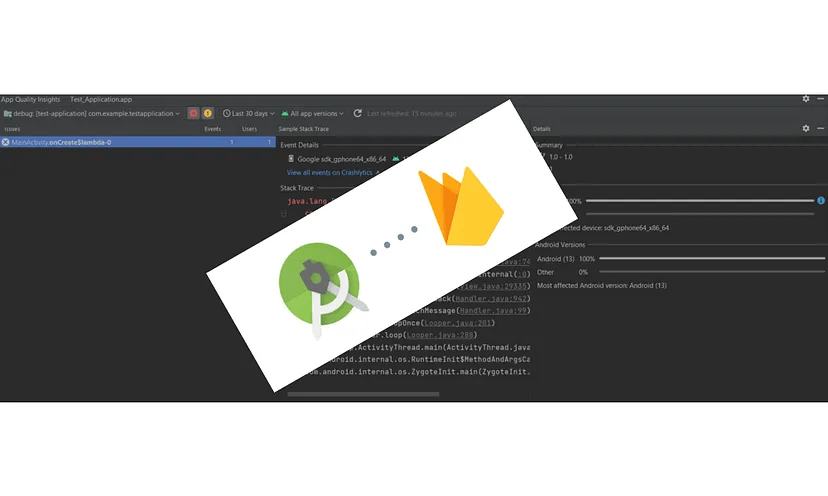
Once the sign-in is successful, you can then navigate to the App Quality Insights tool window. You should see the Issues, Sample Stack Trace, and Details panels populate with reports from Crashlytics.

- If you are yet to setup Firebase Crashlytics for your app, then you can do so by going to Tools > Firebase > Crashlytics
This will open Firebase Assistant in the assistant window. Follow the instructions on the screen, it will ask you to create a Firebase project first and will then add the required Crashlytics dependencies to the project
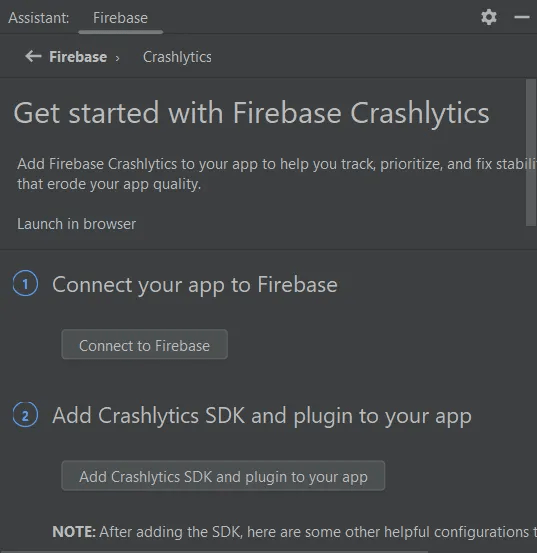
Once the integration is successful you should see a success message in the Firebase Assistant
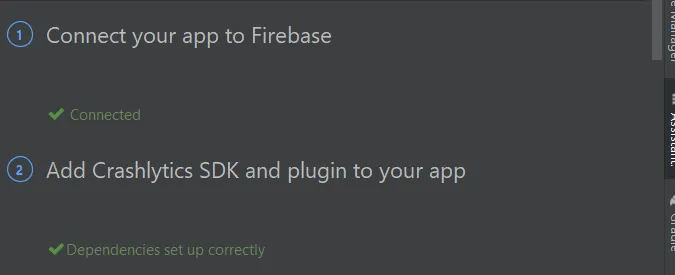
Now all you need to do is sign in to the Android Studio using the same developer account that has access to your app in Firebase.
You should now be able to see the crash stats in the App Quality Insights tool window
And since you have reached this far in the article, it would be great to leave a comment below
References:
1 thought on “How to Access Firebase Crashlytics Insights in the Android Studio”